Python繪圖實現臺風路徑可視化代碼實例
臺風是重大災害性天氣,臺風引起的直接災害通常由三方面造成,狂風、暴雨、風暴潮,除此以外臺風的這些災害極易誘發城市內澇、房屋倒塌、山洪、泥石流等次生災害。正因如此,臺風在科研和業務工作中是研究的重點。希望這次臺風路徑可視化可以給予大家一點點幫助。
臺風路徑的獲取
中國氣象局(CMA)
中國氣象局(CMA)的臺風最佳路徑數據集(BST),BST是之后對歷史臺風路徑進行校正后發布的,其經緯度、強度、氣壓具有更高的可靠性,但是時間分辨率為6小時,部分3小時,這一點不如觀測數據。下載地址:
http://tcdata.typhoon.org.cn/
溫州臺風網
溫州臺風網的數據是實時發布數據的記錄,時間分辨率最高達1小時,對于臺風軌跡具有更加精細化的表述。下載地址:
http://www.wztf121.com/
示例
導入模塊并讀取數據,使用BST的2018年臺風路徑數據作為示例,已經將原始的txt文件轉換為xls文件。
import os, globimport pandas as pdimport numpy as npimport shapely.geometry as sgeomimport matplotlib.pyplot as pltfrom matplotlib.image import imreadfrom matplotlib.animation import FuncAnimationimport matplotlib.lines as mlinesimport cartopy.crs as ccrsimport cartopy.feature as cfeatfrom cartopy.mpl.ticker import LongitudeFormatter,LatitudeFormatterimport cartopy.io.shapereader as shpreaderimport cartopy.io.img_tiles as cimgtfrom PIL import Imageimport warnings warnings.filterwarnings(’ignore’)df = pd.read_csv(’./2018typhoon.csv’)
定義等級色標
def get_color(level): global color if level == ’熱帶低壓’ or level == ’熱帶擾動’: color=’#FFFF00’ elif level == ’熱帶風暴’: color=’#6495ED’ elif level == ’強熱帶風暴’: color=’#3CB371’ elif level == ’臺風’: color=’#FFA500’ elif level == ’強臺風’: color=’#FF00FF’ elif level == ’超強臺風’: color=’#DC143C’ return color
定義底圖函數
def create_map(title, extent): fig = plt.figure(figsize=(12, 8)) ax = fig.add_subplot(1, 1, 1, projection=ccrs.PlateCarree()) url = ’http://map1c.vis.earthdata.nasa.gov/wmts-geo/wmts.cgi’ layer = ’BlueMarble_ShadedRelief’ ax.add_wmts(url, layer) ax.set_extent(extent,crs=ccrs.PlateCarree()) gl = ax.gridlines(draw_labels=False, linewidth=1, color=’k’, alpha=0.5, linestyle=’--’) gl.xlabels_top = gl.ylabels_right = False ax.set_xticks(np.arange(extent[0], extent[1]+5, 5)) ax.set_yticks(np.arange(extent[2], extent[3]+5, 5)) ax.xaxis.set_major_formatter(LongitudeFormatter()) ax.xaxis.set_minor_locator(plt.MultipleLocator(1)) ax.yaxis.set_major_formatter(LatitudeFormatter()) ax.yaxis.set_minor_locator(plt.MultipleLocator(1)) ax.tick_params(axis=’both’, labelsize=10, direction=’out’) a = mlines.Line2D([],[],color=’#FFFF00’,marker=’o’,markersize=7, label=’TD’,ls=’’) b = mlines.Line2D([],[],color=’#6495ED’, marker=’o’,markersize=7, label=’TS’,ls=’’) c = mlines.Line2D([],[],color=’#3CB371’, marker=’o’,markersize=7, label=’STS’,ls=’’) d = mlines.Line2D([],[],color=’#FFA500’, marker=’o’,markersize=7, label=’TY’,ls=’’) e = mlines.Line2D([],[],color=’#FF00FF’, marker=’o’,markersize=7, label=’STY’,ls=’’) f = mlines.Line2D([],[],color=’#DC143C’, marker=’o’,markersize=7, label=’SSTY’,ls=’’) ax.legend(handles=[a,b,c,d,e,f], numpoints=1, handletextpad=0, loc=’upper left’, shadow=True) plt.title(f’{title} Typhoon Track’, fontsize=15) return ax
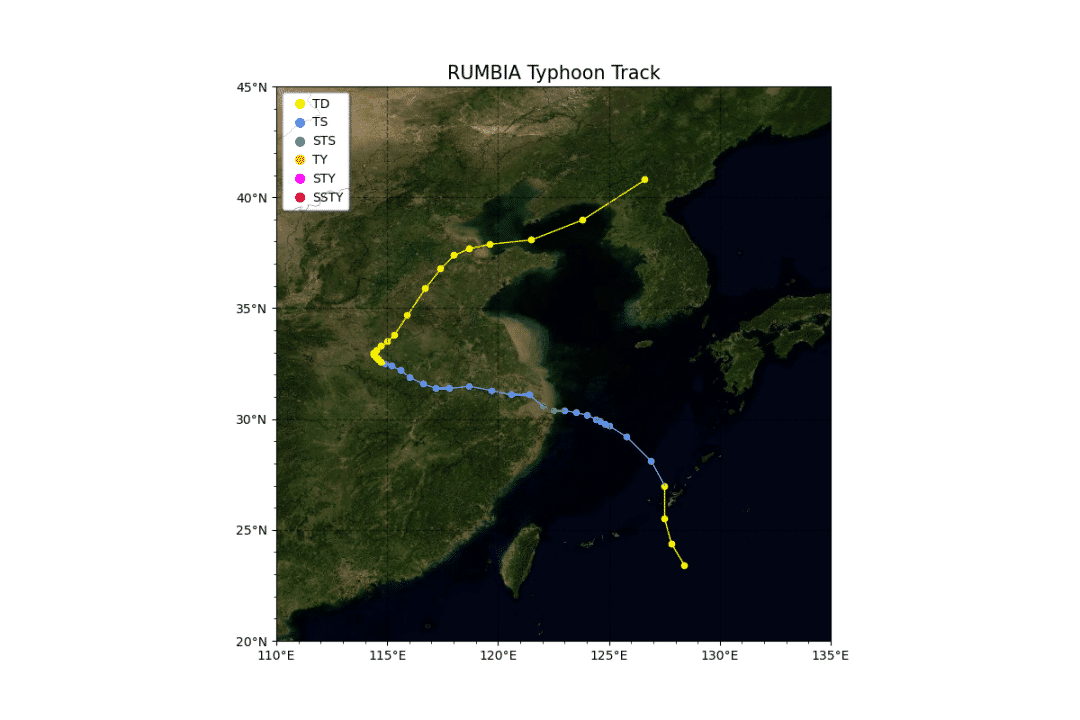
定義繪制單個臺風路徑方法,并繪制2018年第18號臺風溫比亞。
def draw_single(df): ax = create_map(df[’名字’].iloc[0], [110, 135, 20, 45]) for i in range(len(df)): ax.scatter(list(df[’經度’])[i], list(df[’緯度’])[i], marker=’o’, s=20, color=get_color(list(df[’強度’])[i])) for i in range(len(df)-1): pointA = list(df[’經度’])[i],list(df[’緯度’])[i] pointB = list(df[’經度’])[i+1],list(df[’緯度’])[i+1] ax.add_geometries([sgeom.LineString([pointA, pointB])], color=get_color(list(df[’強度’])[i+1]),crs=ccrs.PlateCarree()) plt.savefig(’./typhoon_one.png’)draw_single(df[df[’編號’]==1818])
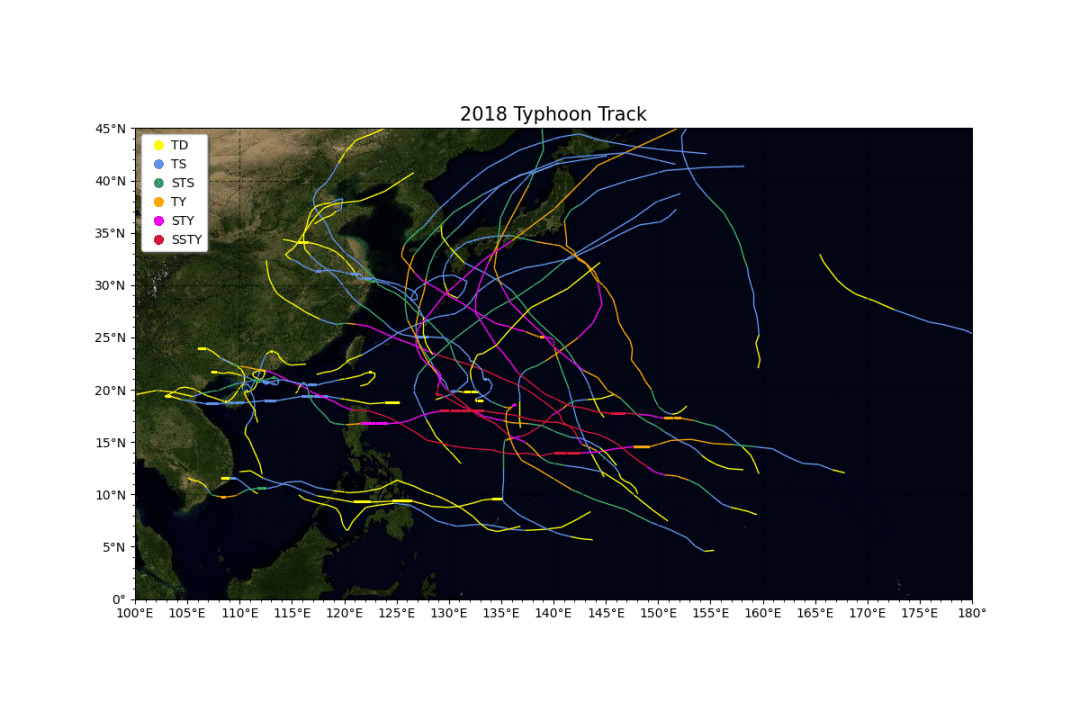
定義繪制多個臺風路徑方法,并繪制2018年全年的全部臺風路徑。
def draw_multi(df): L = list(set(df[’編號’])) L.sort(key=list(df[’編號’]).index) ax = create_map(’2018’, [100, 180, 0, 45]) for number in L: df1 = df[df[’編號’]==number] for i in range(len(df1)-1): pointA = list(df1[’經度’])[i],list(df1[’緯度’])[i] pointB = list(df1[’經度’])[i+1],list(df1[’緯度’])[i+1] ax.add_geometries([sgeom.LineString([pointA, pointB])], color=get_color(list(df1[’強度’])[i+1]),crs=ccrs.PlateCarree()) plt.savefig(’./typhoon_multi.png’)draw_multi(df)
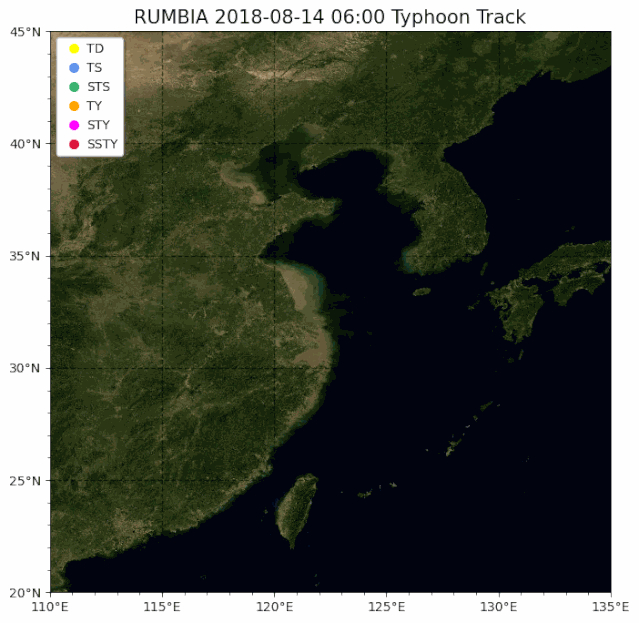
定義繪制單個臺風gif路徑演變方法,并繪制2018年第18號臺風的gif路徑圖。
def draw_single_gif(df): for state in range(len(df.index))[:]: ax = create_map(f’{df['名字'].iloc[0]} {df['時間'].iloc[state]}’, [110, 135, 20, 45]) for i in range(len(df[:state])): ax.scatter(df[’經度’].iloc[i], df[’緯度’].iloc[i], marker=’o’, s=20, color=get_color(df[’強度’].iloc[i])) for i in range(len(df[:state])-1): pointA = df[’經度’].iloc[i],df[’緯度’].iloc[i] pointB = df[’經度’].iloc[i+1],df[’緯度’].iloc[i+1] ax.add_geometries([sgeom.LineString([pointA, pointB])], color=get_color(df[’強度’].iloc[i+1]),crs=ccrs.PlateCarree()) print(f’正在繪制第{state}張軌跡圖’) plt.savefig(f’./{df['名字'].iloc[0]}{str(state).zfill(3)}.png’, bbox_inches=’tight’) # 將圖片拼接成動畫 imgFiles = list(glob.glob(f’./{df['名字'].iloc[0]}*.png’)) images = [Image.open(fn) for fn in imgFiles] im = images[0] filename = f’./track_{df['名字'].iloc[0]}.gif’ im.save(fp=filename, format=’gif’, save_all=True, append_images=images[1:], duration=500)draw_single_gif(df[df[’編號’]==1818])
以上就是本文的全部內容,希望對大家的學習有所幫助,也希望大家多多支持好吧啦網。
相關文章:

 網公網安備
網公網安備