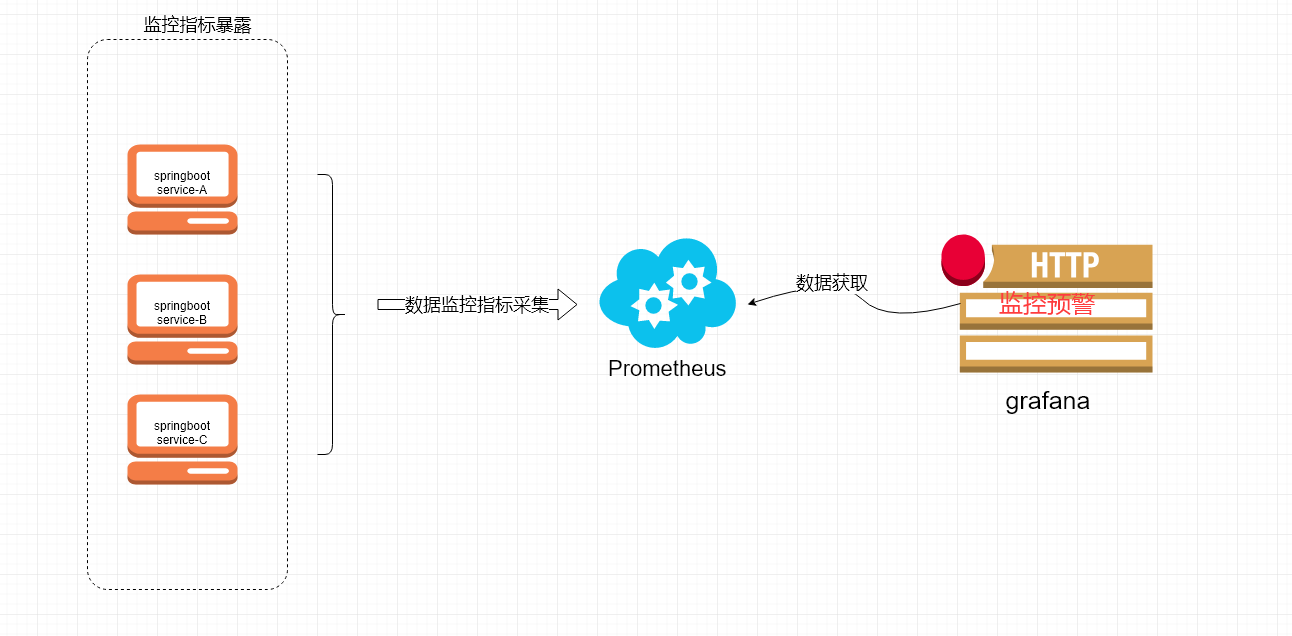
SpringBoot可視化監控的具體應用
本文主要介紹了Spring Boot 應用可視化監控,分享給大家,具體如下:
首先,添加依賴如下依賴:
<dependency> <groupId>org.springframework.boot</groupId> <artifactId>spring-boot-starter-actuator</artifactId> </dependency> /*采集應用的指標信息,我們使用的是prometheus,相應的我們引入包:*/<dependency> <groupId>io.prometheus</groupId><artifactId>simpleclient_spring_boot</artifactId> <version>0.0.26</version> </dependency>
然后,在啟動類 Application.java 添加如下注解:
@SpringBootApplication@EnablePrometheusEndpoint@EnableSpringBootMetricsCollectorpublic class Application { public static void main(String[] args) {SpringApplication.run(Application.class, args); }}
最后,配置默認的登錄賬號和密碼,在 application.yml 中:
security: user: name:user password: pwd
啟動應用程序后,會看到如下一系列的 Mappings
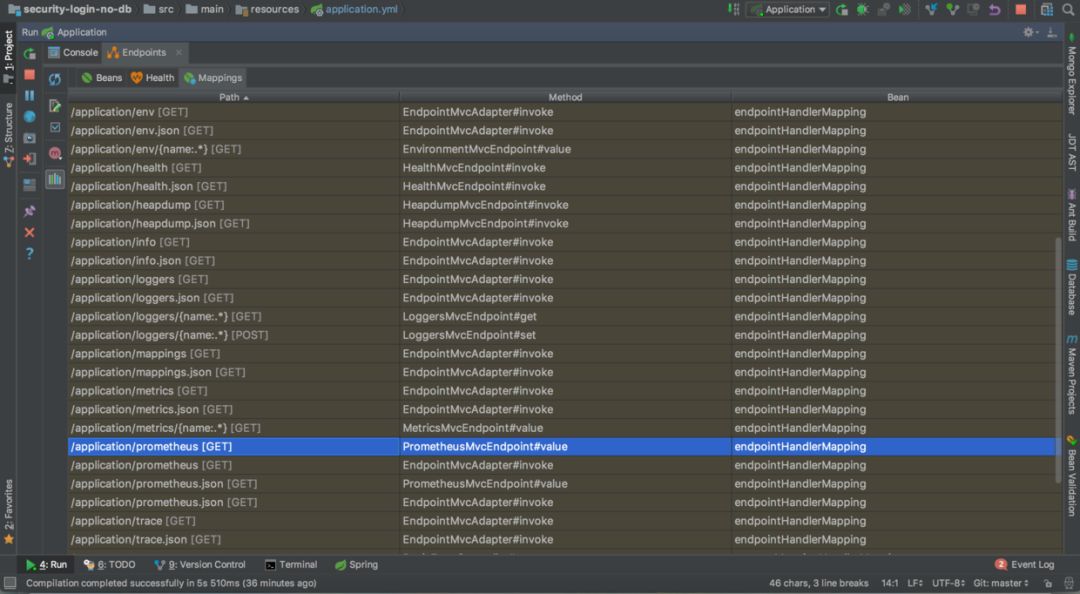
利用賬號密碼訪問 http://localhost:8080/application/prometheus ,可以看到 Prometheus 格式的指標數據

首先,獲取 Prometheus 的 Docker 鏡像:
$ docker pull prom/prometheus
然后,編寫配置文件 prometheus.yml :
global: scrape_interval: 10s scrape_timeout: 10s evaluation_interval: 10mscrape_configs: - job_name: spring-boot scrape_interval: 5s scrape_timeout: 5s metrics_path: /application/prometheus scheme: http basic_auth: username: admin password: 123456 static_configs: - targets:- 192.168.11.54:8099 #此處填寫 Spring Boot 應用的 IP + 端口號
接著,啟動 Prometheus :
docker run -d --name prometheus -p 9090:9090-v D:testactuatorprometheusprometheus.yml:/etc/prometheus/prometheus.yml prom/prometheus
請注意,D:testactuatorprometheusprometheus.yml ,是我的配置文件存放地址,我們需要將它放到容器里面去,所以用了-v來做文件映射。/etc/prometheus/prometheus.yml這個是容器啟動的時候去取的默認配置,這里我是直接覆蓋掉了它。prom/prometheus這是鏡像,如果本地沒有,就回去你設置好的鏡像倉庫去取。
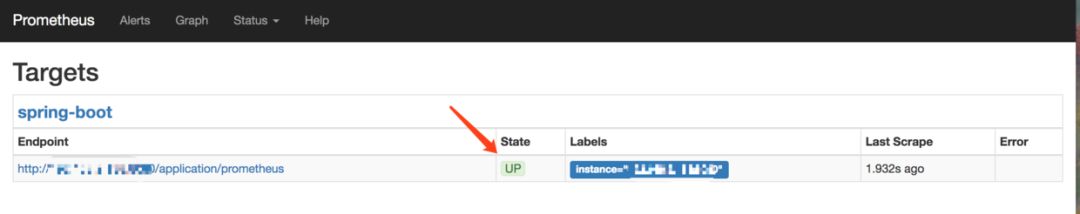
啟動完成后用**docker ps**看下是否已經啟動成功,之后打開瀏覽器輸入:http://localhost:9090/targets,檢查 Spring Boot 采集狀態是否正常,如果看到下圖就是成功了。
首先,獲取 Grafana 的 Docker 鏡像:
$ docker pull grafana/grafana
然后,啟動 Grafana:
$ docker run --name grafana -d -p 3000:3000 grafana/grafana
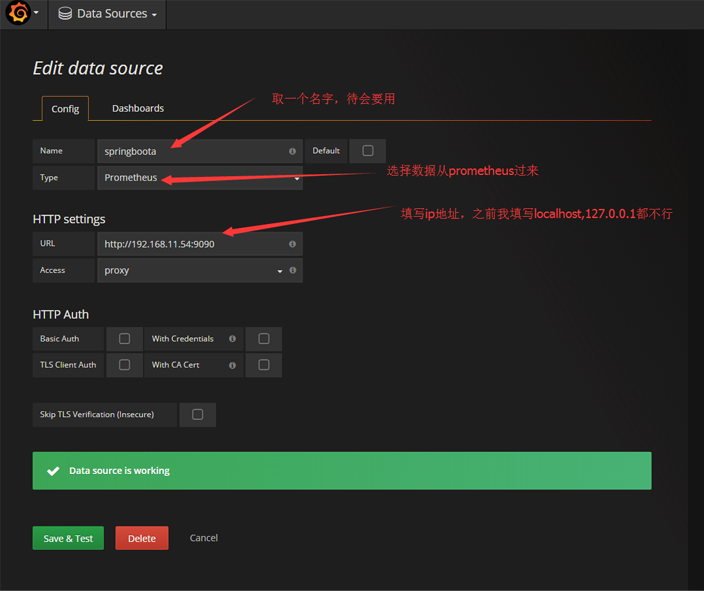
接著,訪問 http://localhost:3000/ 配置 Prometheus 數據源:
Grafana 登錄賬號 admin 密碼 admin
先配置數據源.
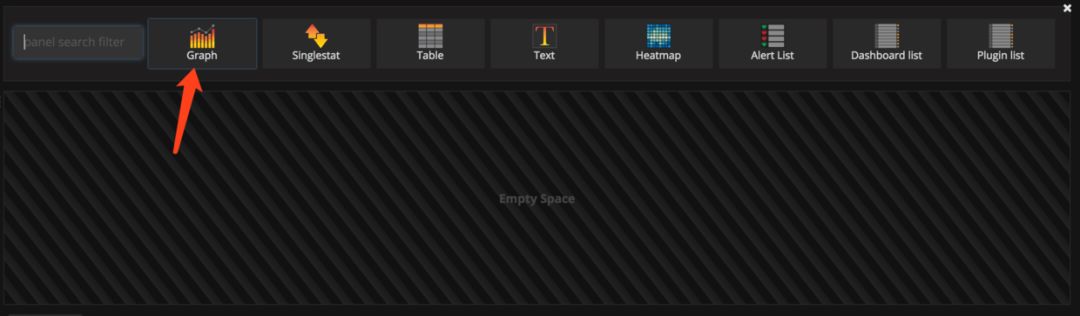
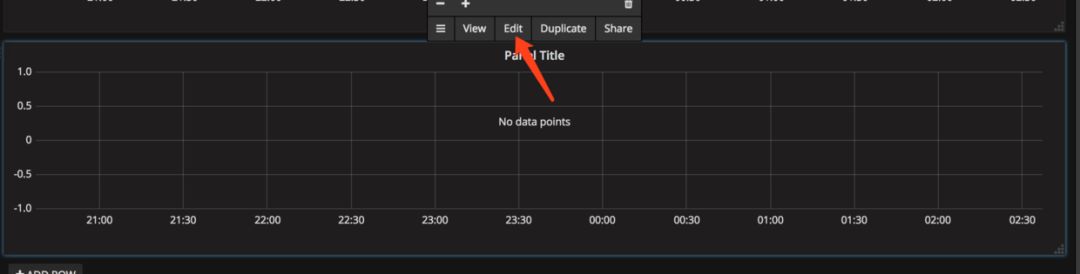
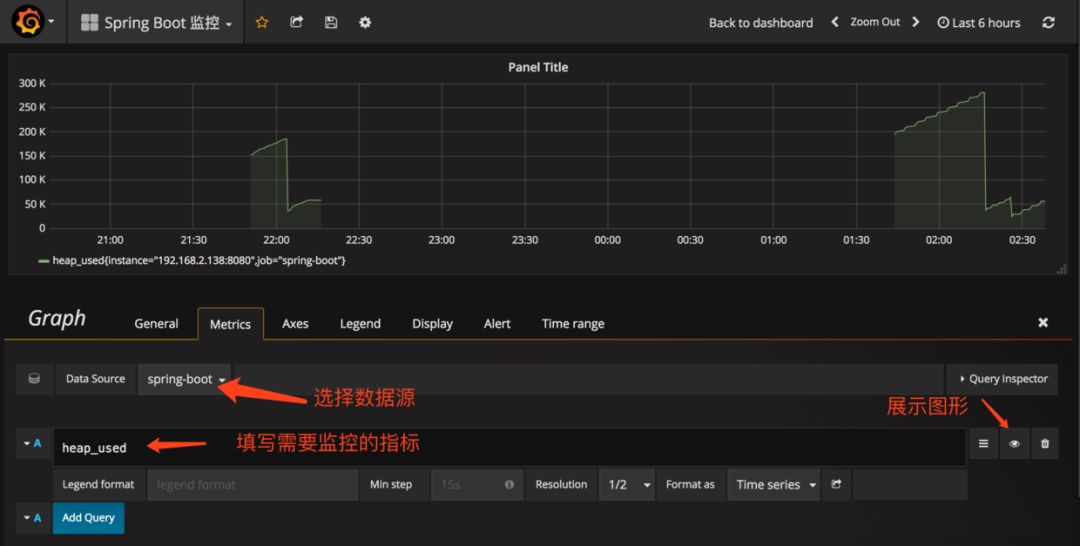
2.配置單個指標的可視化監控面板:
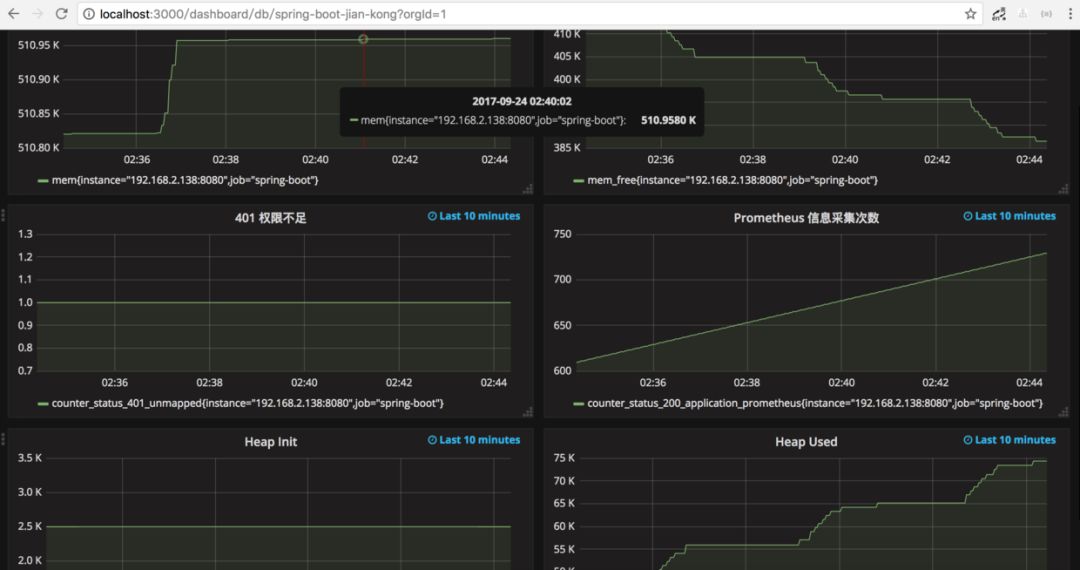
prometh采集的數據

到此這篇關于SpringBoot可視化監控的具體應用的文章就介紹到這了,更多相關SpringBoot可視化監控內容請搜索好吧啦網以前的文章或繼續瀏覽下面的相關文章希望大家以后多多支持好吧啦網!
相關文章:

 網公網安備
網公網安備