Prometheus監(jiān)控Springboot程序的實(shí)現(xiàn)方法
我本次使用的Springboot版本為1.5.12.RELEASE,如果是Springboot2.0+,那么監(jiān)控的配置以及吐出的監(jiān)控指標(biāo)會(huì)有所不同。添加maven依賴,pom文件配置如下:
<dependency> <groupId>io.prometheus</groupId> <artifactId>simpleclient_spring_boot</artifactId> <version>${prometheus.client.version}</version> </dependency> <dependency> <groupId>io.prometheus</groupId> <artifactId>simpleclient</artifactId> <version>${prometheus.client.version}</version> </dependency> <dependency> <groupId>io.prometheus</groupId> <artifactId>simpleclient_hotspot</artifactId> <version>${prometheus.client.version}</version> </dependency>
其中Prometheus的版本號(hào)為:
<prometheus.client.version>0.5.0</prometheus.client.version>2. 修改配置文件
修改application.properties配置文件,添加如下內(nèi)容:
server.port=8080# 啟用基礎(chǔ)認(rèn)證security.basic.enabled = false# 安全路徑列表,逗號(hào)分隔,此處只針對(duì)/admin路徑進(jìn)行認(rèn)證security.basic.path = /admin# 認(rèn)證使用的用戶名security.user.name = admin# 認(rèn)證使用的密碼。 默認(rèn)情況下,啟動(dòng)時(shí)會(huì)記錄隨機(jī)密碼。security.user.password = 123456# 可以訪問管理端點(diǎn)的用戶角色列表,逗號(hào)分隔management.security.roles = SUPERUSER# actuator暴露接口使用的端口,為了和api接口使用的端口進(jìn)行分離management.port = 8099# actuator暴露接口的前綴management.context-path = /admin# actuator是否需要安全保證management.security.enabled = false# actuator的metrics接口是否需要安全保證endpoints.metrics.sensitive = false# actuator的metrics接口是否開啟endpoints.metrics.enabled=true# actuator的health接口是否需要安全保證endpoints.health.sensitive=false# actuator的health接口是否開啟endpoints.health.enabled=true
application.yml 配置如下:
# actuator是否需要安全保證management.security.enabled: falseendpoints: metrics: # actuator的metrics接口是否需要安全保證 sensitive: false # actuator的metrics接口是否開啟 enabled: true health: # actuator的health接口是否需要安全保證 sensitive: false # actuator的health接口是否開啟 enabled: true3. 啟用Prometheus監(jiān)控
在Springboot啟動(dòng)類上添加注解@EnablePrometheusEndpoint,同時(shí)使用simpleclient_hotspot中提供的DefaultExporter該Exporter會(huì)在metrics endpoint中放回當(dāng)前應(yīng)用JVM的相關(guān)信息
@SpringBootApplication@EnablePrometheusEndpoint@EnableSpringBootMetricsCollectorpublic class CaseApplication implements CommandLineRunner { public static void main(String[] args) { SpringApplication.run(CaseApplication.class, args); } @Override public void run(String... strings) throws Exception { DefaultExports.initialize(); }}4. 監(jiān)控埋點(diǎn)4.1 新建攔截器
建立一個(gè)攔截器,用來攔截URL。
public class PrometheusMetricsInterceptor implements HandlerInterceptor { private Histogram.Timer histogramRequestTimer; private Histogram.Timer nacosTimer; private Histogram.Child nacosChild; static final Histogram requestLatencyHistogram = Histogram.build().labelNames('path', 'method', 'code') .name('io_namespace_http_requests_latency_seconds_histogram').help('Request latency in seconds.') .register(); @Override public boolean preHandle(HttpServletRequest request, HttpServletResponse response, Object handler) throws Exception { System.out.println('-------Histogram--------'); histogramRequestTimer = requestLatencyHistogram .labels(request.getRequestURI(), request.getMethod(), String.valueOf(response.getStatus())) .startTimer(); nacosTimer = MetricsMonitor.getConfigRequestMonitor(request.getMethod(), request.getRequestURI(), String.valueOf(response.getStatus())); nacosChild = MetricsMonitor.getNamingRequestMonitor(request.getMethod(), request.getRequestURI(), String.valueOf(response.getStatus())); return true; } @Override public void postHandle(HttpServletRequest request, HttpServletResponse response, Object handler, ModelAndView modelAndView) throws Exception { } @Override public void afterCompletion(HttpServletRequest request, HttpServletResponse response, Object handler, Exception ex) throws Exception { histogramRequestTimer.observeDuration(); nacosTimer.observeDuration(); nacosChild.startTimer(); }}4.2 注冊(cè)攔截器
新建攔截器后需要注冊(cè)到服務(wù)中才可以攔截URL。
@Configurationpublic class WebServletContextConfiguration extends WebMvcConfigurationSupport { @Override public void addInterceptors(InterceptorRegistry registry) { registry.addInterceptor(getInterceptor()).addPathPatterns('/**'); super.addInterceptors(registry); } @Bean public HandlerInterceptor getInterceptor() { return new PrometheusMetricsInterceptor(); }}5. 驗(yàn)證監(jiān)控
啟動(dòng)應(yīng)用程序,訪問地址http://localhost:8099/admin/prometheus,驗(yàn)證是否存在監(jiān)控指標(biāo)。
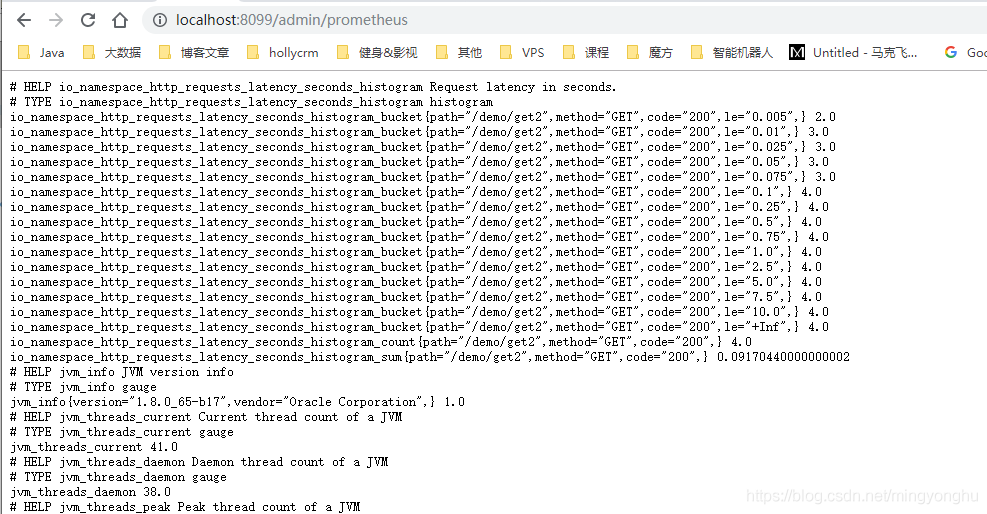
普羅米修斯客戶端庫提供了四種核心度量類型。目前,它們只在客戶端庫(為了使api能夠根據(jù)特定類型的使用而定制)和wire協(xié)議中有所區(qū)別。Prometheus服務(wù)器還沒有利用類型信息,并將所有數(shù)據(jù)壓縮成無類型的時(shí)間序列。這種情況在未來可能會(huì)改變。
6.1 Counter計(jì)數(shù)器是一個(gè)累積度量,它表示一個(gè)單調(diào)遞增的計(jì)數(shù)器,其值在重新啟動(dòng)時(shí)只能遞增或重置為零。例如,您可以使用計(jì)數(shù)器來表示服務(wù)的請(qǐng)求、完成的任務(wù)或錯(cuò)誤的數(shù)量。不要使用計(jì)數(shù)器來暴露可能降低的值。例如,不要為當(dāng)前正在運(yùn)行的進(jìn)程的數(shù)量使用計(jì)數(shù)器;而是使用量規(guī)。示例代碼:
import io.prometheus.client.Counter;class YourClass { static final Counter requests = Counter.build() .name('requests_total').help('Total requests.').register(); void processRequest() { requests.inc(); // Your code here. }}6.2 Gauge
量規(guī)是一個(gè)度量單位,它表示一個(gè)可以任意上下移動(dòng)的數(shù)值。壓力表通常用于測量溫度或當(dāng)前內(nèi)存使用情況等測量值,但也用于“計(jì)數(shù)”,比如并發(fā)請(qǐng)求的數(shù)量。示例代碼:
class YourClass { static final Gauge inprogressRequests = Gauge.build() .name('inprogress_requests').help('Inprogress requests.').register(); void processRequest() { inprogressRequests.inc(); // Your code here. inprogressRequests.dec(); }}6.3 Histogram
直方圖對(duì)觀察結(jié)果(通常是請(qǐng)求持續(xù)時(shí)間或響應(yīng)大小之類的東西)進(jìn)行采樣,并在可配置的桶中計(jì)數(shù)。它還提供所有觀測值的和。示例代碼:
class YourClass { static final Histogram requestLatency = Histogram.build() .name('requests_latency_seconds').help('Request latency in seconds.').register(); void processRequest(Request req) { Histogram.Timer requestTimer = requestLatency.startTimer(); try { // Your code here. } finally { requestTimer.observeDuration(); } }}6.4 Summary
與柱狀圖類似,摘要對(duì)觀察結(jié)果進(jìn)行采樣(通常是請(qǐng)求持續(xù)時(shí)間和響應(yīng)大小之類的內(nèi)容)。雖然它還提供了觀察值的總數(shù)和所有觀察值的總和,但它計(jì)算了一個(gè)滑動(dòng)時(shí)間窗口上的可配置分位數(shù)。
class YourClass { static final Summary receivedBytes = Summary.build() .name('requests_size_bytes').help('Request size in bytes.').register(); static final Summary requestLatency = Summary.build() .name('requests_latency_seconds').help('Request latency in seconds.').register(); void processRequest(Request req) { Summary.Timer requestTimer = requestLatency.startTimer(); try { // Your code here. } finally { receivedBytes.observe(req.size()); requestTimer.observeDuration(); } }}6.5 自定義Collector
有時(shí)不可能直接測試代碼,因?yàn)樗辉谀目刂品秶鷥?nèi)。這要求您代理來自其他系統(tǒng)的指標(biāo)。為此,您需要?jiǎng)?chuàng)建一個(gè)自定義收集器(需要將其注冊(cè)為普通度量)。
class YourCustomCollector extends Collector { List<MetricFamilySamples> collect() { List<MetricFamilySamples> mfs = new ArrayList<MetricFamilySamples>(); // With no labels. mfs.add(new GaugeMetricFamily('my_gauge', 'help', 42)); // With labels GaugeMetricFamily labeledGauge = new GaugeMetricFamily('my_other_gauge', 'help', Arrays.asList('labelname')); labeledGauge.addMetric(Arrays.asList('foo'), 4); labeledGauge.addMetric(Arrays.asList('bar'), 5); mfs.add(labeledGauge); return mfs; }}// Registrationstatic final YourCustomCollector requests = new YourCustomCollector().register()7. 安裝配置Prometheus7.1 安裝配置
下載安裝包
wget https://github.com/prometheus/prometheus/releases/download/v2.12.0/prometheus-2.12.0.linux-amd64.tar.gz
解壓文件
tar -zxvf prometheus-2.12.0.linux-amd64.tar.gz
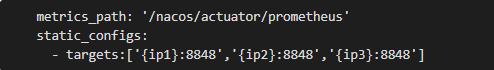
修改配置文件prometheus.yml采集Nacos metrics數(shù)據(jù)。配置監(jiān)控的job以及目標(biāo)服務(wù)器,每一個(gè)目標(biāo)服務(wù)器都是一個(gè)實(shí)例。
cd prometheus-*
后臺(tái)啟動(dòng)Prometheus服務(wù),并出到日志。
./prometheus --config.file=prometheus.yml > prometheus.log 2>&1 &
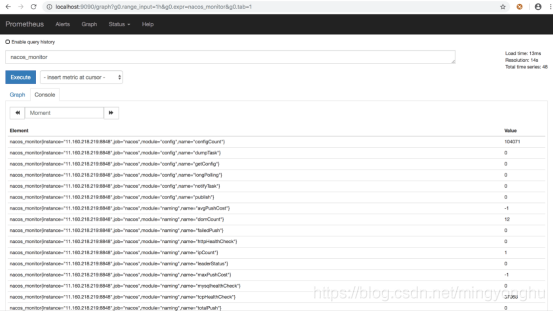
通過訪問http://{ip}:9090/graph可以看到prometheus的采集數(shù)據(jù),在搜索欄搜索監(jiān)控指標(biāo),例如:nacos_monitor可以搜索到Nacos數(shù)據(jù)說明采集數(shù)據(jù)成功
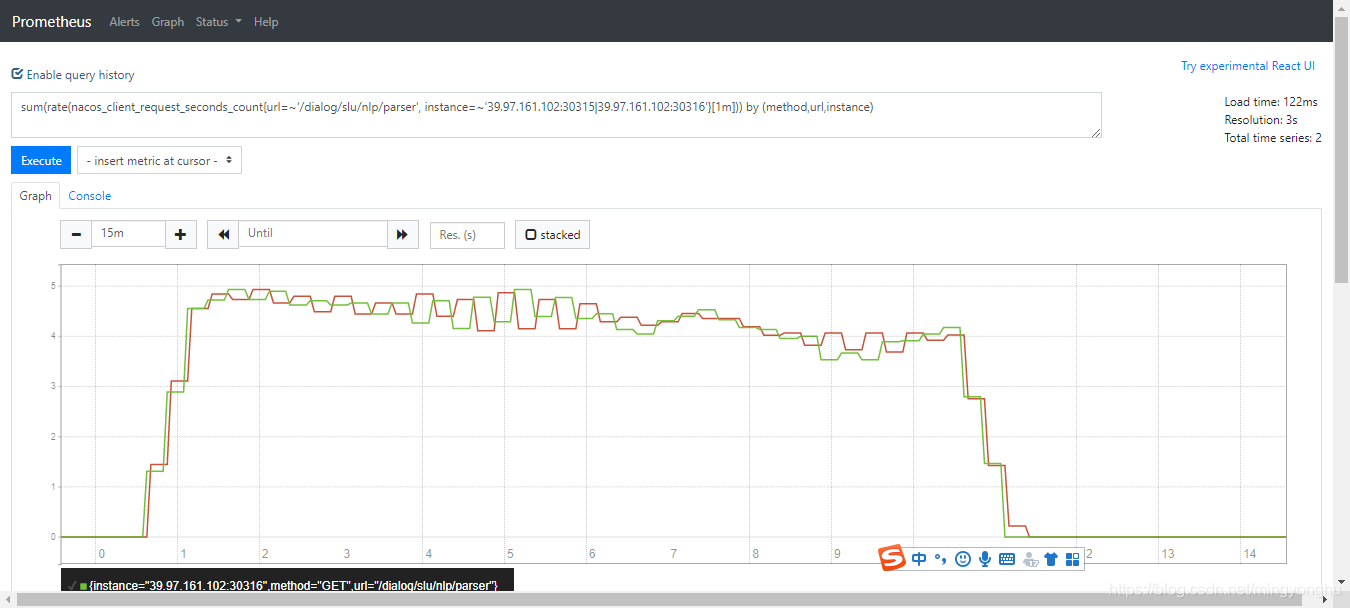
在查詢條件框中輸入表達(dá)式,進(jìn)行統(tǒng)計(jì)。例如:
sum(rate(nacos_client_request_seconds_count{url=~’/dialog/slu/nlp/parser’, instance=~’39.97.161.102:30315|39.97.161.102:30316’}[1m])) by (method,url,instance)
結(jié)果如下圖:
安裝grafana,下載安裝包
wget https://dl.grafana.com/oss/release/grafana-6.5.2.linux-amd64.tar.gztar -zxvf grafana-6.5.2.linux-amd64.tar.gz
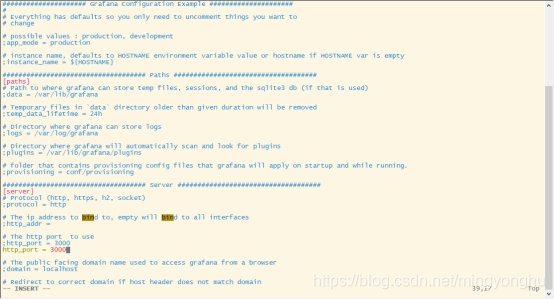
修改端口配置,復(fù)制一個(gè)配置文件,后續(xù)修改基于該自定義配置文件修改,不需要修改原始文件。
cd grafana-6.5.2/confcp sample.ini custom.inivi custom.ini
可以在該配置文件中修改端口號(hào)
訪問grafana: http://{ip}:3000,用戶名密碼默認(rèn)為:admin/admin。

登錄時(shí)提示修改默認(rèn)密碼,如果不想修改可以跳過。
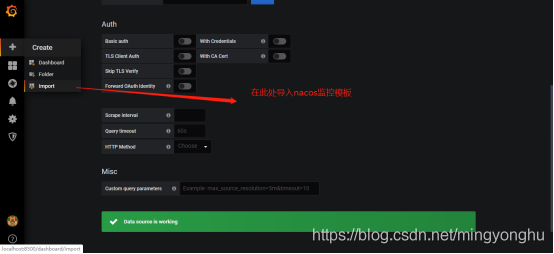
8.2 配置數(shù)據(jù)源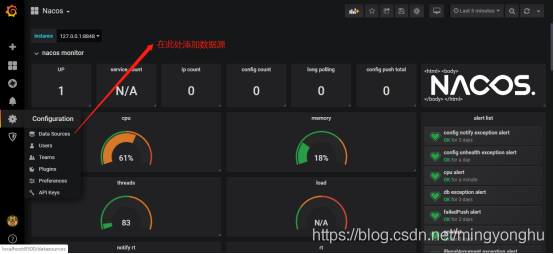

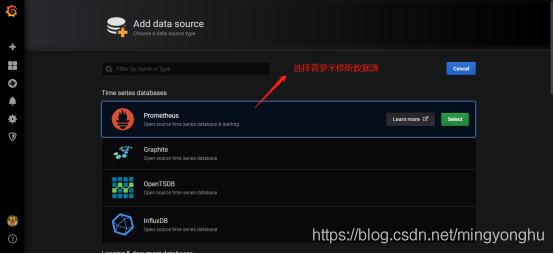
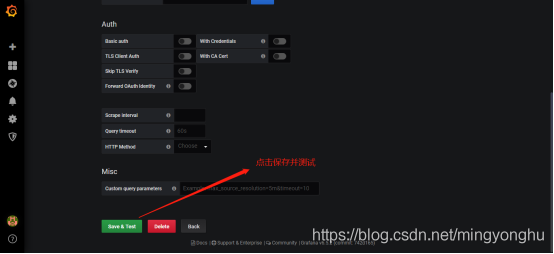
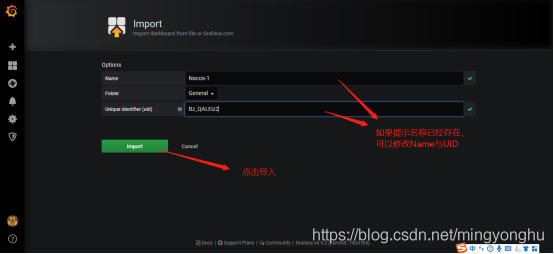
監(jiān)控面板可以自己配置,也可以通過導(dǎo)入json文件來進(jìn)行修改,推薦使用配置好的json文件,修改起來會(huì)非常方便。

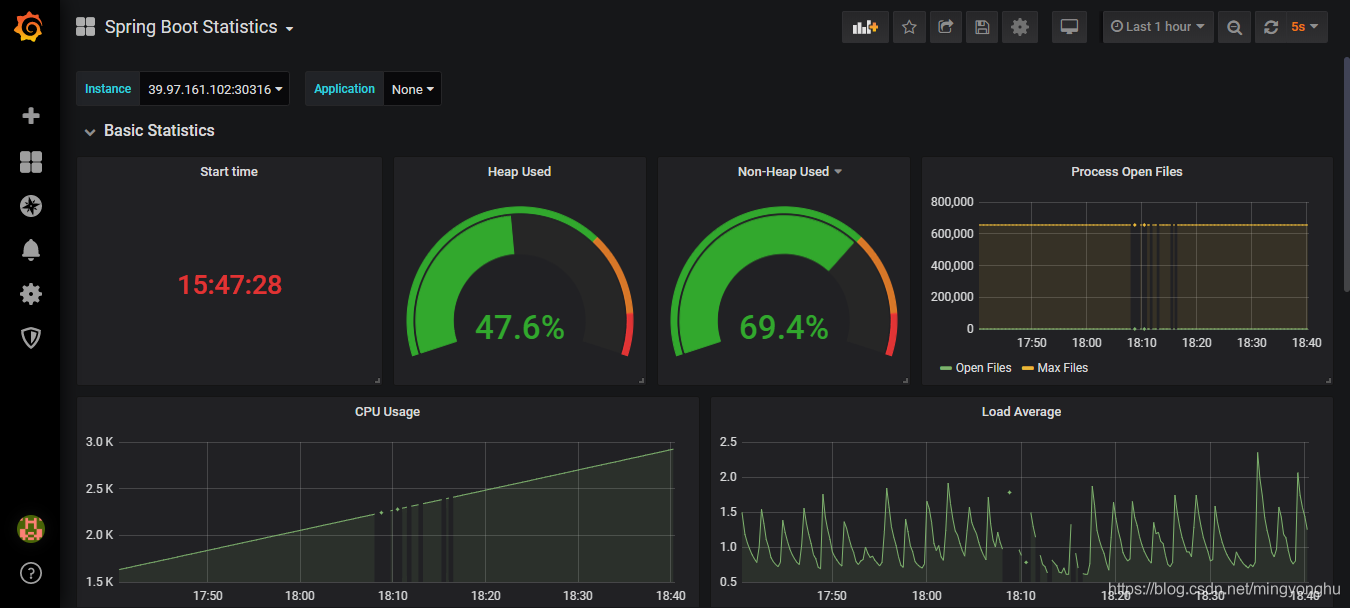
修改后的展示效果如圖所示:
注:此處grafana的模板文件是從別處下載的,可以根據(jù)需要導(dǎo)入自己的模板文件。
9. 參考文獻(xiàn)SpringBoot 應(yīng)用監(jiān)控踩坑集錦
prometheus docs
到此這篇關(guān)于Prometheus監(jiān)控Springboot程序的實(shí)現(xiàn)方法的文章就介紹到這了,更多相關(guān)Prometheus監(jiān)控Springboot內(nèi)容請(qǐng)搜索好吧啦網(wǎng)以前的文章或繼續(xù)瀏覽下面的相關(guān)文章希望大家以后多多支持好吧啦網(wǎng)!
相關(guān)文章:
1. 不要在HTML中濫用div2. react實(shí)現(xiàn)組件狀態(tài)緩存的示例代碼3. CSS百分比padding制作圖片自適應(yīng)布局4. React優(yōu)雅的封裝SvgIcon組件示例5. Vue如何使用ElementUI對(duì)表單元素進(jìn)行自定義校驗(yàn)及踩坑6. Electron調(diào)用外接攝像頭并拍照上傳實(shí)現(xiàn)詳解7. CSS清除浮動(dòng)方法匯總8. HTML5實(shí)戰(zhàn)與剖析之觸摸事件(touchstart、touchmove和touchend)9. HTTP協(xié)議常用的請(qǐng)求頭和響應(yīng)頭響應(yīng)詳解說明(學(xué)習(xí))10. TypeScript實(shí)現(xiàn)十大排序算法之歸并排序示例詳解
 網(wǎng)公網(wǎng)安備