Python matplotlib實時畫圖案例
實時畫圖
import matplotlib.pyplot as pltax = [] # 定義一個 x 軸的空列表用來接收動態的數據ay = [] # 定義一個 y 軸的空列表用來接收動態的數據plt.ion() # 開啟一個畫圖的窗口for i in range(100): # 遍歷0-99的值 ax.append(i) # 添加 i 到 x 軸的數據中 ay.append(i**2) # 添加 i 的平方到 y 軸的數據中 plt.clf() # 清除之前畫的圖 plt.plot(ax,ay) # 畫出當前 ax 列表和 ay 列表中的值的圖形 plt.pause(0.1) # 暫停一秒 plt.ioff() # 關閉畫圖的窗口
實時畫圖 效果圖
補充知識:Python 繪圖與可視化 matplotlib 動態條形圖 bar
第一種辦法
一種方法是每次都重新畫,包括清除figure
def animate(fi): bars=[] if len(frames)>fi: # axs.text(0.1,0.90,time_template%(time.time()-start_time),transform=axs.transAxes)#所以這樣 time_text.set_text(time_template%(0.1*fi))#這個必須沒有axs.cla()才行 # axs.cla() axs.set_title(’bubble_sort_visualization’) axs.set_xticks([]) axs.set_yticks([]) bars=axs.bar(list(range(Data.data_count)),#個數 [d.value for d in frames[fi]],#數據 1, #寬度 color=[d.color for d in frames[fi]]#顏色 ).get_children() return bars anim=animation.FuncAnimation(fig,animate,frames=len(frames), interval=frame_interval,repeat=False)
這樣效率很低,而且也有一些不可取的弊端,比如每次都需要重新設置xticks、假如figure上添加的有其他東西,這些東西也一并被clear了,還需要重新添加,比如text,或者labale。
第二種辦法
可以像平時畫線更新data那樣來更新bar的高
’’’遇到問題沒人解答?小編創建了一個Python學習交流QQ群:857662006 尋找有志同道合的小伙伴,互幫互助,群里還有不錯的視頻學習教程和PDF電子書!’’’import matplotlib.pyplot as pltimport numpy as npfrom matplotlib import animation fig=plt.figure(1,figsize=(4,3))ax=fig.add_subplot(111)ax.set_title(’bar_animate_test’)#ax.set_xticks([])注釋了這個是能看到變化,要不看不到變化,不對,能看到變化,去了注釋吧#ax.set_yticks([])ax.set_xlabel(’xlable’)N=5frames=50x=np.arange(1,N+1) collection=[]collection.append([i for i in x])for i in range(frames): collection.append([ci+1 for ci in collection[i]])print(collection)xstd=[0,1,2,3,4]bars=ax.bar(x,collection[0],0.30)def animate(fi): # collection=[i+1 for i in x] ax.set_ylim(0,max(collection[fi])+3)#對于問題3,添加了這個 for rect ,yi in zip(bars,collection[fi]): rect.set_height(yi) # bars.set_height(collection) return barsanim=animation.FuncAnimation(fig,animate,frames=frames,interval=10,repeat=False)plt.show()
問題
*)TypeError: ‘numpy.int32’ object is not iterable
x=np.arange(1,N+1)<br>collection=[i for i in x]#collection=[i for i in list(x)]#錯誤的認為是dtype的原因,將這里改成了list(x)for i in range(frames): collection.append([ci+1 for ci in collection[i]])#問題的原因是因為此時的collection還是一個一位數組,所以這個collection[i]是一個x里的一個數,并不是一個列表,我竟然還以為的dtype的原因,又改了xstd=[0,1,2,3,4]
應該是
’’’遇到問題沒人解答?小編創建了一個Python學習交流QQ群:857662006 尋找有志同道合的小伙伴,互幫互助,群里還有不錯的視頻學習教程和PDF電子書!’’’collection=[]collection.append([i for i in x])#成為二維數組for i in range(frames): collection.append([ci+1 for ci in collection[i]])
然后又出現了下面的問題:
*)TypeError: only size-1 arrays can be converted to Python scalars
Traceback (most recent call last): File 'forTest.py', line 22, in <module> bars=ax.bar(x,collection,0.30) File 'C:UsersAdministrator.SC-201605202132Envssortlibsite-packagesmatplotlib__init__.py', line 1589, in inner return func(ax, *map(sanitize_sequence, args), **kwargs) File 'C:UsersAdministrator.SC-201605202132Envssortlibsite-packagesmatplotlibaxes_axes.py', line 2430, in bar label=’_nolegend_’, File 'C:UsersAdministrator.SC-201605202132Envssortlibsite-packagesmatplotlibpatches.py', line 707, in __init__ Patch.__init__(self, **kwargs) File 'C:UsersAdministrator.SC-201605202132Envssortlibsite-packagesmatplotlibpatches.py', line 89, in __init__ self.set_linewidth(linewidth) File 'C:UsersAdministrator.SC-201605202132Envssortlibsite-packagesmatplotlibpatches.py', line 368, in set_linewidth self._linewidth = float(w)TypeError: only size-1 arrays can be converted to Python scalars
應該是傳遞的參數錯誤,仔細想了一下,在報錯的代碼行中,collection原來是沒錯的,因為原來是一維數組,現在變成二維了,改為
bars=ax.bar(x,collection[0],0.30)
好了
*)出現的問題,在上面的代碼中,運行的時候不會畫布的大小不會變,會又條形圖溢出的情況,在animate()中添加了
’’’遇到問題沒人解答?小編創建了一個Python學習交流QQ群:857662006 尋找有志同道合的小伙伴,互幫互助,群里還有不錯的視頻學習教程和PDF電子書!’’’def animate(fi): # collection=[i+1 for i in x] ax.set_ylim(0,max(collection[fi])+3)#添加了這個 for rect ,yi in zip(bars,collection[fi]): rect.set_height(yi) # bars.set_height(collection) return bars
別的屬性
*)條形圖是怎樣控制間隔的:
是通過控制寬度
width=1,#沒有間隔,每個條形圖會緊挨著
*)errorbar:
是加一個橫線,能通過xerr和yerr來調整方向
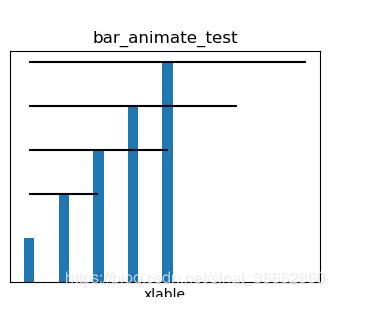
xstd=[0,1,2,3,4]bars=ax.bar(x,collection,0.30,xerr=xstd)
以上這篇Python matplotlib實時畫圖案例就是小編分享給大家的全部內容了,希望能給大家一個參考,也希望大家多多支持好吧啦網。
相關文章:

 網公網安備
網公網安備